
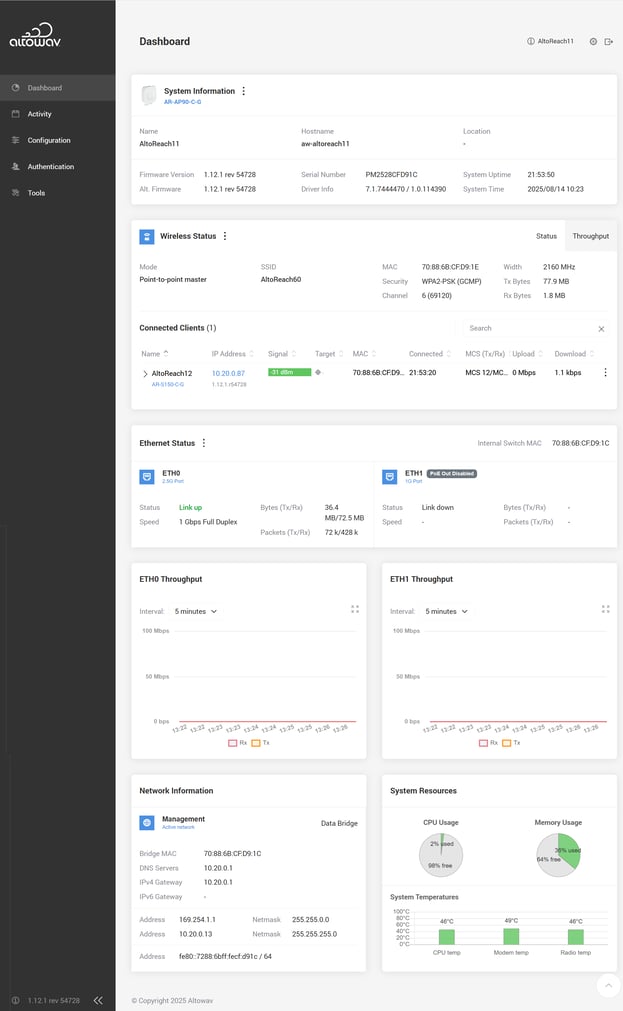
The device dashboard shows the overall status of your device:
- System information
- 60GHz Wireless status
- Ethernet status
- ETH0 throughput
- Network information
- System resources
For each widget that has configuration activities associated with it, users with admin permissions can click the menu icon () next to the widget name and select Configure to change to the applicable configuration page.
System information
This section will show you information about your device, including:
- Device name, hostname, and location.
- The firmware version running on the active bootbank, and the firmware version stored in the alternate backup bootbank.
- The device's serial number.
- 60GHz driver and antenna config versions. These fields are mainly used for debug purposes.
- Device uptime since last reboot.
- Current system time: this is the device's current date and time. Timezone (where applicable) and other time settings are configurable from the System settings page.
60GHz Wireless status
Different information is displayed on the Wireless status widget, depending on whether the device is in access point/point-to-point master mode, or station/point-to-point slave mode.
Access point/master
The Wireless status widget for an access point or point-to-point master displays the following:
- Mode — The wireless mode of the device.
- SSID — The 60GHz SSID used by the 60GHz wireless connection.
- MAC — The MAC address of the wireless interface.
- Security — The Security mode being used by the 60GHz wireless connection.
- Channel — The frequency channel being used by the 60GHz wireless connection.
- Width — The channel width.
- Tx Bytes and RX Bytes — The total transmitted and received bytes.
- Connected clients — Information about any stations or the point-to-point slave connected to the device.
- You can connect to the WebUI of the station or slave by clicking the listed IP address.
- Click the menu icon () to the right of the client and select Kick client to remove an active link to a connected station or slave. This can be useful when using station connection profiles to force your station to connect to a different AP.
- Click the arrow () to the left of the client to expand information about the client.
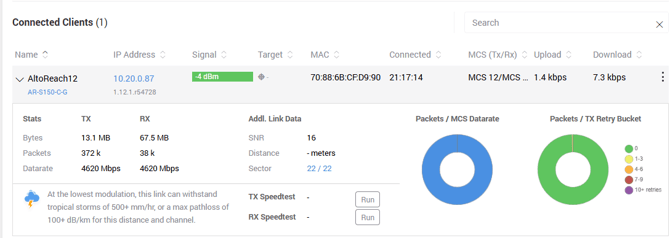
In the expanded client display, you can:
- Click the Sector link to open the sector map.
- Click Run next to TX Speedtest or RX Speedtest to perform speedtests for the link.
- See Station/slave for information about other fields in the expanded client display.
Station/slave
The Wireless status widget for an station or point-to-point slave displays the following:
- Connection status:
- Signal strength
- SSID
- Connection time
- Distance
- MCS datarate
- The system observes the link's traffic during the 5 minute interval, and determines how many packets were sent for each MCS rate.
- Lower MCS rates have a lighter yellow color, and turn darker blue the higher the rate.
- Packet retries
- The system observes the link's traffic during the 5 minute interval, and determines how many packets were retried.
- Retried packets are categorized into buckets based on the number of retries. If a large number of packets are reported as requiring multiple retries, check the link for obstructions. If there are no obstructions, it's possible that there are problems with reflections. See Troubleshooting your link for more information.
- Speedtest
- Click Run next to TX Speedtest or RX Speedtest to perform a transmit or receive speedtest on the link.
The speedtest tool pushes small burst of packets across a link, so running it will not have any noticeable effect on customer traffic, nor on the wireless throughput graph.
- Click Run next to TX Speedtest or RX Speedtest to perform a transmit or receive speedtest on the link.
- Link availability — Describes the predicted allowed rain that the link and channel can withstand at MCS1.
- Information about the access point or point-to-point master that this station or slave is connected to.
- You can connect to the WebUI of the access point or master by clicking the listed IP address.
Throughput
Click Throughput to display the link throughput in chart format. You can change the interval that the chart uses to display the data; intervals greater than five minutes can be minimum, maximum or average received or transmitted bytes.
Click the Maximize icon (  ) to display the chart in full screen mode. Click the Minimize icon (
  ) to return to regular view.
Ethernet status
Provides status of the Ethernet port: Link status, speed, transmitted amounts and speed.
ETH0 throughput
Provides throughput of the Ethernet port. You can change the interval that the chart uses to display the data; intervals greater than five minutes can be minimum, maximum or average received or transmitted bytes.
Click the Maximize icon ( ) to display the chart in full screen mode. Click the Minimize icon ( ) to return to regular view.
Network information
Provides information related to the Network configuration of the data bridge:
- Bridge MAC address
- IPv4 addresses of DNS servers
- IPv4 and IPv6 address of the network gateway
- Bridge IPv4 and IPv6 addresses
- Netmask settings
System resources
Displays CPU and memory usage, and system temperature.