
As part of incident reporting within AltoCommand, you configure thresholds for what indicents are included in reports. You can:
- Enable/disabe incidents.
- Set thresholds levels for incidents to be reported.
- Set intervals required for the incident report to be triggered.
The default settings for incident reporting are sufficient for most circumstances. However, it may be that your specific implementation requires different reporting.
Incident threshold settings are only available for AltoPlex devices. This feature is not available for K60 devices.
To view incident reporting:
-
Open the AltoCommand WebUI:
In your browser's address bar, type:
https://hostname
where hostname is the fully qualified domain name of the AltoCommand server.
-
Log into the WebUI as a user with admin privileges.
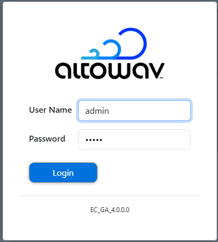
The default username is admin
The default password is admin
-
Click Settings > Incidents & Actions.
The Incidents & Actions page displays.
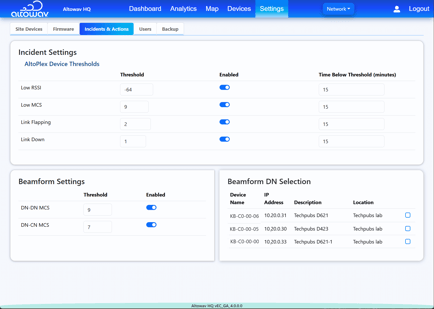
The Incidents Settings pane is used to configure incident reporting by enabling/disabling incidents, as well as setting thresholds and intervals. The following incidents are available for configuration:
Low RSSI — RSSI (Received Signal Strength Indicator) is a measurement of how well a device can receive signals from external wireless devices. The higher the number, the better the signal strength. By default, when the average RSSI for a device is below -64 dBm for 15 minutes, an incident report is logged and displayed on the Incidents tab of the Dashboard.
Low MCS — MCS (Modulation Coding Scheme) is a measurement of how efficiently data is being transferred over a wireless connection. AltoPlex devices use a weighted MCS value of 2-12. By default, when the average weighted MCS of a device is below 9 for 15 minutes, an incident report is logged and displayed on the Incidents tab of the Dashboard.
RF Link Flapping — Link flapping refers to a link that goes down and comes back up. By default, if a device has two link flapping incidents in a period of 15 minutes, an incident report is logged and displayed on the Incidents tab of the Dashboard.
Link Down — By default, if a link is reported as down for 15 minutes, an incident report is logged and displayed on the Incidents tab of the Dashboard.