
The Analytics page shows traffic and performance data for a device's links. Filters and display options enable viewing data for specific devices or links over a selected period of time.
To view the Analytics page:
-
Open the AltoCommand WebUI:
In your browser's address bar, type:
https://hostname
where hostname is the fully qualified domain name of the AltoCommand server.
-
Log into the WebUI as a user with either user or admin privileges.
- From the menu bar, click Analytics.
The Analytics page opens.
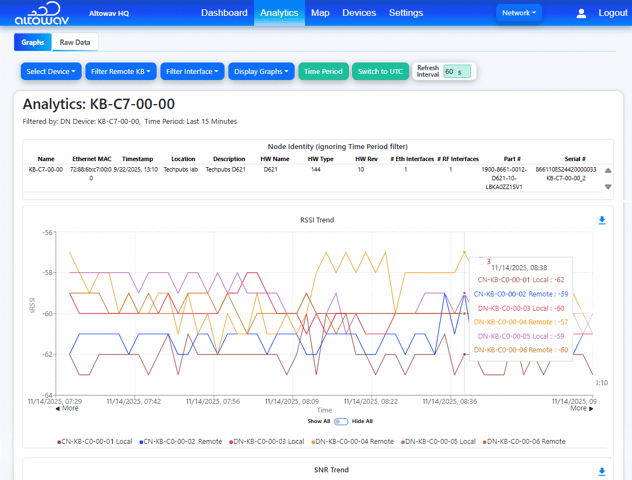
The Analytics page has tabs that display graphs or raw data.
Graphs — Shows the data in line graphs of data plotted against time. This, combined with colors and other features of the graphs, enable quick visual assessment of multiple data points at one time.
- Download an image (.png) of the graph by clicking the Document Download (
 ) icon. Downloaded .png files are named by type of graph, device selected date and timestamp. For example: srssi_DN-KB-C0-00-00_Thu, 26 Oct 2025 22_01_59 GMT.png.
 - For data older than 30 days, data is down sampled to create graphs. Outliers for this data are retained when creating these graphs. This is done to visually highlight issues, making them easier to find. For example, the weighted MCS values include instances of the lowest MCS, making that issue easier to identify and address. Another example is retaining throughput and power spikes to making those cases easier to trace to specific times and devices.
- See Tips for Viewing Graphs for operational tips.
Raw Data — Shows the data listed in table form, arranged in these categories: Radio Status Data, Radio Status PER data, MCS Histogram Data, MCS Weighted Average Data, Performance Data, Node Identity Data. See Raw Data, for a more detailed description.
Filters
A row of buttons above the data allows you to filter what is displayed on the page. Blue buttons filter for device, interface, remote device, and, for the Graphs tab, which graphs to display. Green buttons control the time periods shown, including a refresh interval for the display.

To select specific link(s) to view, start by selecting the device, then filter by interface, and then select the remote device. These selections will stay in place while you select various time periods, select graphs to view, refresh data or move between raw data and graphs.
When a different device is selected, the interface and remote settings are retained if available. Otherwise, they are reset.
A brief description of each of the controls for the Analytics page:
Select Device — Select the DN or Hub device on the local side of the link to view. You can view the device list by either Location or Description. Default: The first device listed.
Filter Remote KB — Select the remote device hostname(s) from the list, Select All or limit the remotes to Only DNs, (this option appears when both DN and CN links are available). This selection determines which link(s) to graph. Default: Select all - All devices linked to the device and interfaces selected.
Filter Interface — Select the specific interface(s) on the selected device to graph. This is useful for devices with multiple interfaces, such as the K60DN. Default: Select all.
Display Graphs — Select which graphs to view. Settings are retained, until reset by the user. Graphs show the data for the time period selected, except for Node Identity.
- Node Identity — Displays information about the selected device, such as MAC address, hardware name, and software version.
- sRSSI — Graphs the received signal strength indicator in dBm as polled from devices at the local and remotes of the link.
- Link Quality (K60 only) — A number between 0 and 100 indicating the quality of the link.
- sSNREst (AltoPlex only) — Graphs signal to noise ratio estimate.
- TX Power Index (AltoPlex only) — Graphs the transmission power in dBm as polled from devices at the local and remote ends of the link. (AltoPlex devices only.)
- RF Channel — Displays a graph of the RF channel used.
- Weighted MCS — Graphs the weighted average MCS for the link.
- Beam Index — Displays a graph of the Rx Beam Index and of the TX Beam Index for the device.
- Rx Beam Azimuth (AltoPlex only) — The Rx beam angle. (AltoPlex devices only.)
- Tx Beam Azimuth (AltoPlex only) — The Tx beam angle. (AltoPlex devices only.)
- Throughput — Displays transmission and receiving performance for the link measured in Mb/sec.
- Block Error Rate (nSyn/nCW) (AltoPlex only) — Displays a ratio of erroneous blocks to the total blocks transmitted. (AltoPlex devices only.)
- Device Temperature — The temperature of the device over time.
- GPS Accuracy (AltoPlex only) — The accuracy of the latest reading, in meters, of the device's GPS.
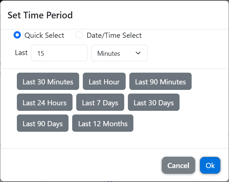
Time Period — Select the time period to graph. This time period remains selected until a different device is selected or a different time period is selected.
Switch to UTC / Switch to Local - Toggles between displaying analytics in UTC or in local time.
Refresh Interval (sec) - Set the interval for refreshing the graphs. 60 seconds is the minimum refresh interval. Setting the interval to 0 disables data refresh. Default is 0.
Raw Data
The Raw Data tab on the Analytics page shows polled raw data for a device's link in table format. Categories for raw data include Radio Status Data, Radio Status Packet Error Rate (PER) Data, MCS Histogram Data, MCS Weighted Average Data, Performance Data and Node Identity Data.
The selected DNs, interfaces, remotes and time periods remain the same as you navigate between Analytics graphs and Analytics raw data or refresh the tables. You can adjust the filtering from either page.
Click on the data categories to expand or collapse the data. For example, click on Radio Status PER Data to show the packet error rate data from Radio Status, filtered by the device, interface and time selected.
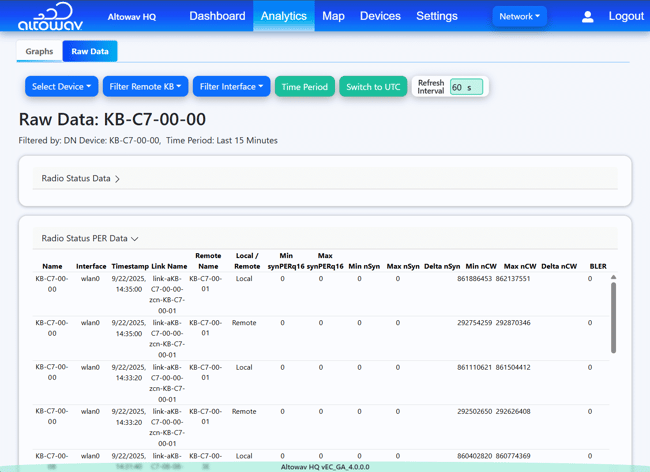
Raw data listings are useful for cases where a more detailed investigation of performance or operational parameters is required for a specific device, during a specific time period.