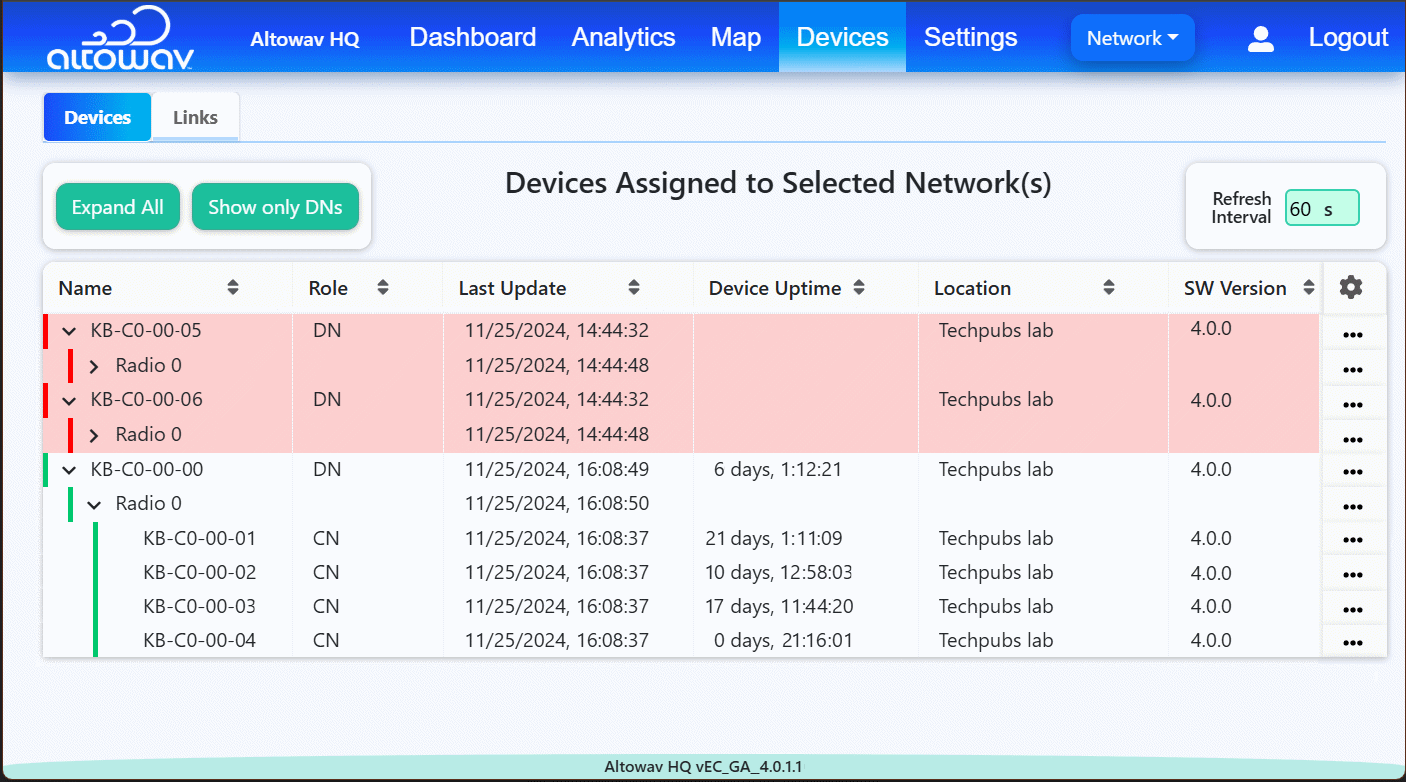
The Devices page shows a snapshot of device status, using color to highlight operational issues.
- A green bar (I) at the start of a row shows a healthy device and link, normal operations.
- A red bar (I) at the start of a row indicates an issue with a device, or an issue with a link between devices.
- Light red highlighting on a row shows the device or sector with the broken links or reachability issue.
- Click to expand or to collapse the list of the device's interfaces and linked devices.
Sorting and filtering the Devices list
- To change the devices that are displayed based on the Network they are assigned to:
- In the menu bar, click Network .
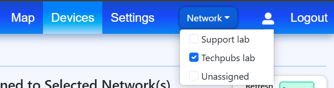
- Select the appropriate Network or Networks.
- In the menu bar, click Network .
- Click a column heading to sort it by ascending () or descending () order.
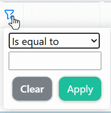
- For any column, a Filter icon (
 ) will appear when you hover the mouse over the column header. Click to open a menu allowing you to filter based on search criteria.
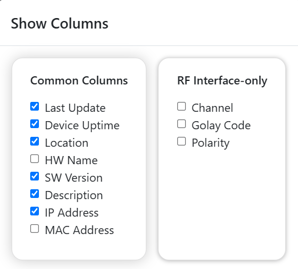
- To select which columns to display, click the Settings icon ().